|
Published: 20 May 2013
Online map of Australia’s clean energy projects
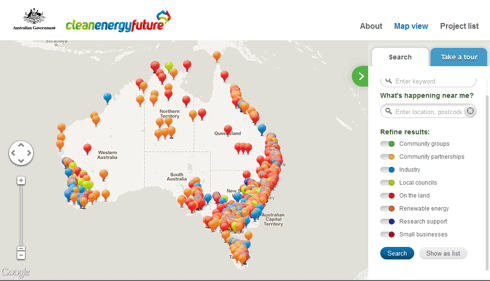
The Federal Government has published a new interactive online map that shows the extent of investment in clean energy projects across Australia.

|
| The Clean Energy Map of Australia |
The Clean Energy Map features more than 1200 projects that are helping the environment by cutting greenhouse gas emissions and helping the economy by reducing energy costs, investing in innovative new technologies and creating new jobs.
The Clean Energy Map is a one-stop-shop for people wanting to find information on clean energy projects. Visitors can enter their postcode, or use GPS functionality, to find information on projects in their region or neighbourhood.
The Federal Minister for Climate Change, Industry and Innovation, Greg Combet said revenue from the carbon price was funding many important local investments.
‘The Clean Energy Map shows there is widespread action around the country to tackle climate change and invest in renewable energy,’ Mr Combet said.
‘Manufacturers are using carbon price revenue to invest in new equipment ranging from cogeneration plants to new refrigeration technologies, delivering significant cost savings.
‘Community organisations, local councils and households are engaged in projects to use energy more efficiently and cost-effectively.
‘Farmers and landholders are undertaking carbon farming projects which are reducing pollution on the land, cutting energy costs and generating new sources of income.’
The Map includes projects being carried out under measures such as the Renewable Energy Target, Solar Cities, Energy Efficiency Information Grants, the Carbon Farming Initiative and the Clean Technology Programs.
It shows that Clean Technology Programs, for instance, are supporting 223 projects at manufacturing businesses around the country. These projects will drive more than $338 million in investment in energy efficient equipment, delivering cost savings of more than $30 million each year.
On average, these projects are reducing manufacturers’ emissions intensity – the amount of pollution emitted for each unit of output – by nearly 50 per cent.
The Map also provides information on initiatives such as: energy efficiency upgrades to local government and community facilities like swimming centres, town halls, museums, street and park lighting; Carbon Farming Initiative projects involving capturing emissions from landfill, environmental plantings of native species, destroying emissions from piggeries and early dry season savanna burning projects in the Top End; and more than 300 projects to improve the biodiversity of Australia's landscape and environment and make it more resilient to climate change impacts.
Source: Australian Government media release


