|
Published: 29 August 2011
Greenhouse gas data, fresh from the source
CSIRO recently launched a new web-based resource to make the latest monthly atmospheric greenhouse gas (GHG) data from Cape Grim available to users inside and outside the scientific community. Cape Grim, in western Tasmania, is one of three premier Baseline Air Pollution Stations in the global monitoring network.

|
|
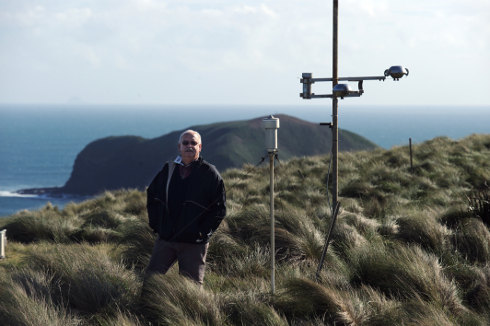
Back to the source: Dr Paul Fraser at Cape Grim, a globally significant greenhouse gas monitoring facility generating data that can now be viewed online. Credit: CSIRO
|
The Cape Grim GHG data web page generates animated graphs of monthly concentrations of the three main greenhouse gases – carbon dioxide, methane and nitrous oxide – as measured at the facility. Since sampling began at Cape Grim, which is jointly operated by the Bureau of Meteorology and CSIRO, more than 30 million GHG measurements have been taken.
Cape Grim’s almost pristine location ensures a high occurrence of air samples are clean and representative of underlying global GHG trends, without the ‘background noise’ associated with air sampling in the northern hemisphere.
Dr Paul Fraser from CSIRO Marine and Atmospheric Research has been analysing GHG concentrations from Cape Grim for more than 35 years. He says the web resource will help ensure the community at large has access to high-quality data that clearly illustrate the impact of human activities on the atmosphere.
‘The atmospheric level of carbon dioxide, the most important long-lived GHG influenced by human activities, is at its highest level in more than 1–2 million years,’ says Dr Fraser.
‘The measurements testify to a steady rise in carbon dioxide concentrations in the Earth’s atmosphere, mainly caused by the burning of fossil fuels and deforestation. This is fundamental information in determining the global actions needed to avoid GHGs rising to dangerous levels.
‘These measurements allow us to trace the dramatic rise in carbon dioxide levels from about 280 ppm before the start of the industrial era around the year 1800, to 388 ppm in 2010. That’s an increase of almost 40 per cent, largely due to human activities.’
The website’s dynamic interface allows users to observe the progressive trends of the three important greenhouse gases influenced directly by human activities and natural variability: carbon dioxide, methane and nitrous oxide.
Data for synthetic greenhouse and ozone-depleting gases, such as chlorofluorocarbons (CFCs), are also available. Water vapour, although an important GHG, is not significantly influenced directly by human activities.
The CSIRO website puts the increase in GHG concentrations over recent decades in the context of longer-term variations over the past 1000 years – determined by analysing gases extracted from tiny air bubbles trapped in Antarctic ice.
After the eruption of Chile’s Puyehue volcano earlier this year, CSIRO was inundated with queries about the possible impact on overall GHG emissions.
‘Volcanoes have virtually no impact on long-term CO2 levels,’ says Dr Fraser. ‘When people see this massive plume of aerosol [microscopic particles suspended in the atmosphere that generally cool the climate by reflecting sunlight back to space] going up into the atmosphere, they just assume it must affect GHG data.’
‘To deal with public data requests, what we needed was some sort of gateway where the public could get access to the data straight away.
‘It’s the same when people see a massive plume of water vapour coming out of power stations: they think it’s CO2 and it's not. The CO2 being emitted along with the water vapour is invisible to the eye.’
Dr Fraser says another question often put to his team is: What were GHG levels doing when temperatures increased during the Medieval Warm Period (950–1250 AD) or during the Little Ice Age (1550–1850 AD)?
‘People want to make the connection, “what did the GHG data show?” We want to show them, through ice core data, what GHG levels did during those periods,’ he says.
‘It turns out they did very little, because those changes in climate were regional and were not driven by GHGs – they were caused by other mechanisms, such as solar output and volcanic events.
‘A lot of people naively make the assumption that because we claim the accumulation of GHGs in the atmosphere is driving climate change at present, then all climate change in the past must have been driven by GHGs.
‘There are all sorts of processes that have driven climate change in the past, which may or may not be related to GHGs. People need to understand that while this current climate change is largely driven by GHG changes, that doesn't mean all climate change in the past has been driven by GHGs.’
Dr Fraser says the web page will soon provide users with the ability to download the Cape Grim data and do their own analyses, although he warns that people need to understand a little about the data’s caveats.
‘The data are used to drive models of climate change,’ he says. ‘It is not scientifically sound to do a simple, statistical forward extrapolation of these data to estimate future concentrations.
‘We certainly want to keep improving the page, and we're delighted with the number of hits the site has received and that members of the public are coming to us with suggestions, whether positive or negative.’
More information
Cape Grim data: http://www.csiro.au/greenhouse-gases/


