Print this page

Published: 25 October 2010

Climate Change Bulletin: Improved insights into rising sea levels to aid adaptation

Craig Macaulay

The authors of a new climate science book have called for the development of more robust international ocean and ice sheet monitoring and modelling programs designed to help community adaptation planning keep pace with the threat of rising sea levels.

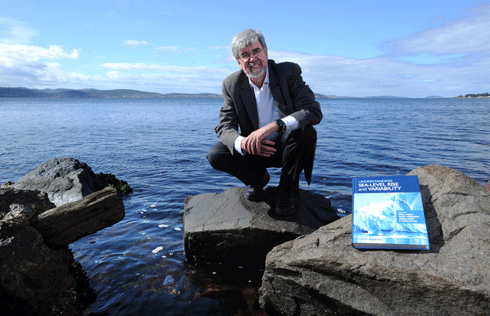
CSIRO’s Dr John Church is lead author of the authoritative new book Understanding Sea-level Rise and Variability.
Credit: CSIRO

‘The good news is that a recent concentration of science resources is improving our insight into ocean and ice dynamics, and scientific measurement of the rate of sea-level rise,’ says the book’s lead editor, CSIRO Fellow and oceanographer Dr John Church.‘The way the world responds to climate change will become increasingly reliant on a sophisticated integrated atmosphere, ocean and ice observing network generating data on future climates, and from which global and regional sea-level rise can be projected.‘The key question is where and how sea-level rise and associated extreme events will have their impact,’ Dr Church says.

The 420-page book, Understanding Sea-level Rise and Variability, is the work of more than 90 scientists from 13 nations led by Dr Church, Dr Philip Woodworth from the Proudman Oceanographic Laboratory UK, Dr Thorkild Aarup from the Intergovernmental Oceanographic Commission (IOC), and Dr Stan Wilson from the US National Oceanic and Atmospheric Administration.

It provides a comprehensive overview of current knowledge on the science of sea-level rise, identifies the major impacts, assesses past sea-level change and the factors contributing to sea-level rise, and assesses how extreme events at the coast will change.

The intended audience includes climate scientists, university lecturers, governments engaged in planning and policy decisions, coastal resource managers, port authorities and emergency and transport service providers.

Dr Church says coastal development has accelerated over the past 50 years. Many of the world’s megacities are situated on the coast, and new infrastructure worth billions of dollars is being constructed. These developments assume that the stable sea levels of the past several millennia will continue. This assumption is no longer true.

‘Populations in low-lying islands and deltaic regions are particularly at risk,’ he says.

‘Our knowledge has improved significantly since satellites were launched to observe the ocean and the ice sheets, and robots deployed to explore the oceans. However, there are critical gaps in observations of the deep ocean, glaciers and ice sheets.

‘Paralleling this, the development of computer simulations projecting ocean and ice sheet dynamics will be the tools that science needs, governments will rely on and coastal communities from the Pacific islands to the river deltas of Asia will be demanding.

‘We cannot ignore sea-level change, because it has the potential to change forever the crowded coastal fringes of our continents,’ Dr Church says.

The book was initiated by the World Climate Research Programme and IOC shortly after Hurricane Katrina in 2005, but before cyclones Sidr and Nargis in 2007 and 2008. All three claimed many thousands of lives.

The world is warming, says 2009 State of the Climate report


The 2009 State of the Climate report released in July draws on data for 10 key climate indicators that all point to the same finding: the scientific evidence that the world is warming is unmistakable.


More than 300 scientists from 160 research groups in 48 countries, including the Bureau of Meteorology and the Department of Climate Change Energy and the Environment, contributed to the report, which confirms that the past decade was the warmest on record, and that the Earth has been growing warmer over the last 50 years.


The report defines 10 measurable planet-wide features used to gauge global temperature changes. Seven indicators are rising: air temperature over land, sea surface temperature, air temperature over oceans, sea level, ocean heat, humidity and tropospheric temperature in the ‘active-weather’ layer of the atmosphere closest to the Earth’s surface. Three indicators are declining: Arctic sea ice, glaciers and spring snow cover in the Northern hemisphere.


More information


Published: 25 October 2010

Atlas to put ‘citizen apps’ on the menu


How can we better integrate data from the many disparate citizen science1 groups around the country to improve the nation’s biodiversity monitoring and research efforts? Coordinators at the Atlas of Living Australia project have been spending time with members of community environmental groups to identify the most effective features for a citizen scientists’ online ‘toolkit’.

Schoolchildren learn how to use the Biodiversity Snapshots application for mobile devices.
Credit: Museum of Victoria

The rapid development of web, map and mobile-based applications in recent years is making it easier for non-scientists to get access to scientific information and to record observations in the field – sometimes for later scientific use.

For example, Museum Victoria has just launched Biodiversity Snapshots, a new mobile application designed to help Year 3–10 school students and their teachers learn more about native wildlife.

The application includes a field guide with photos and sounds of each animal, and a way to record and upload observations on a mobile phone, netbook or tablet. When a student accesses Biodiversity Snapshots on a mobile device, the application presents information such as the animal’s name, shape, features, distribution, behaviour, habitat, sounds, status and ecology. It also lets students survey species found in school grounds, backyards, urban parks, bushland or coastal environments.

Biodiversity Snapshots is a collaboration between Museum Victoria, the Victorian Department of Education and Early Childhood Development, the Atlas of Living Australia and Earthwatch.

Gaia Resources, the consultancy that designed Biodiversity Snapshots, is also developing tools for citizen science groups to collect, organise and edit their data online through the Atlas of Living Australia website (see ECOS 153, p 24). The design process was kicked off earlier this year, with a series of workshops in which members of citizen science groups identified desirable features for an online toolkit. Not surprisingly, ‘easy to use’, ‘portable/mobile’, ‘fast’ and ‘free’ were at the top of their wish lists.

Harnessing the power of people


The combination of citizen science and new technology has produced some interesting projects. Recently, Einstein@home, an online citizen science astronomy project, described what are believed to be the first pulsars discovered through public participation. More than 250?000 volunteers helped Einstein@home to discover more than 100 potential pulsars.


Another international astronomy project, Galaxy Zoo, invited volunteers to judge from images whether galaxies were elliptical or spiral; and, if spiral, whether they were rotating in a clockwise or anti-clockwise direction.


By mid-2007, 80?000 volunteers had already classified more than 10 million images of galaxies. The final Galaxy Zoo datasets contain more than 34.6 million clicks by 82?931 volunteers: a demonstration of the power that citizen science can harness. According to a member of the Galaxy Zoo team, it would have taken researchers years to process the photographs without the volunteers.


Two other unusual initiatives are National Geographic’s archaeology project ‘Field Expedition: Mongolia’, and the San Francisco Neighborhood Parks Council’s ‘ParkScan’ website.


Volunteers in Field Expedition: Mongolia tag potential archaeological dig sites on GeoEye satellite images to assist explorers on the ground in Mongolia (see http://exploration.nationalgeographic.com).


The ParkScan website allows San Franciscans to monitor the condition of city parks and submit park observations directly to City staff (see www.parkscan.org).


The first beta public release of the Atlas of Living Australia website – which has been referred to as a biodiversity ‘yellow pages’– has been scheduled for late October 2010. The website will give researchers and the wider community access to Australian plant, animal and microorganism species’ names, photos, lists and distribution maps, mapping and identification tools, occurrence records, online literature, natural history collections and herbaria, and ecological, observational, and molecular data.

With data from museums, universities, CSIRO, herbaria and other biological collections linked together within a single web environment, users will be able to explore and analyse the information in new ways to develop a more detailed picture of Australia’s biodiversity.

Can you name this gecko, or this tree? The Atlas of Living Australia will provide open access to data such as species names, distribution maps, and mapping and identification tools for reliable identification.
Credit: David McClenaghan

‘The Atlas aims to enable any user to quickly locate and access information across the Internet on all aspects of Australian biodiversity,’ says the Director of the Atlas of Living Australia, Mr Donald Hobern.

For example, users will be able to use the Atlas’ mapping and spatial analysis tools to create a species list for a given area, or map the known occurrence for a species.

The Atlas – which is coordinated by CSIRO – will also give users open access to 50 years of archival material from the Australian Journal of Zoology (a contribution from CSIRO Publishing, which publishes ECOS).

From twitchers to storm chasers

People often ask whether citizen scientists contribute to ‘real’ science. With the right support and coordination, the answer is ‘yes’.

In 2009, for example, the North American Audubon Society analysed 40 years of data from its annual bird count, revealing dramatic shifts northward for winter bird populations as a result of warmer winters. This year's count will help scientists understand the impact of the Gulf oil spill on vulnerable species.

In this country, Birds Australia coordinated a continent-wide survey of birds from 1998–2002, in which thousands of members of the public participated – equipped with binoculars, field guides, GPS units and notebooks. These efforts culminated in the 2003 New Atlas of Australian Birds, presenting 4000 distribution maps for more than 650 bird species, including seasonal changes and breeding range.

Currently, more than 7000 volunteers continue to build Birds Australia’s database of seven million records of birds – the largest biological database in Australia, and one of the largest in the world. Apart from being used by qualified scientists in research projects, the data contributes to Australia’s ‘State of the Environment’ reporting.

Birdwatchers are among the oldest communities of ‘citizen scientists’.
Credit: Rosemary McArthur.

Perhaps the best-known citizen science program in Australia has been the national network of more than 6000 volunteer ‘weather watchers’ coordinated by the Bureau of Meteorology. The volunteers record rainfall, spot storms, and observe river heights and conditions at sea for the Bureau’s weather databases.

Today, members of the public can join any number of citizen science groups, such as ClimateWatch, Frogwatch, Toadbusters, Waterwatch, Operation Spider, Seagrass Watch, Coastcare, Greening Australia, Carnaby's Black-Cockatoo Recovery Project, Conservation Volunteers, Shorebirds 2020 and the Threatened Bird Network.

Of course, an effective citizen science project requires effective volunteer training, technical support, data collection, coordination and encouragement. While data quality can be an issue, innovative tools for ensuring high-quality data are starting to come online. Data collected by volunteers may also need peer review or expert validation.


More information

Atlas of Living Australia, www.ala.org.au


1 Citizen science is the current term for what used to be called ‘amateur science’ or ‘natural history’.


ECOS Archive

Welcome to the ECOS Archive site which brings together 40 years of sustainability articles from 1974-2014.

For more recent ECOS articles visit the blog. You can also sign up to the email alert or RSS feed