|
Published: 18 November 2013
Australia warmed more than the rest of the world in 2013
According to the World Meteorological Organization (WMO), 2013 is on course to be among the top ten warmest years since modern records began in 1850, with Australia recording the highest above-average temperatures globally.

|
|
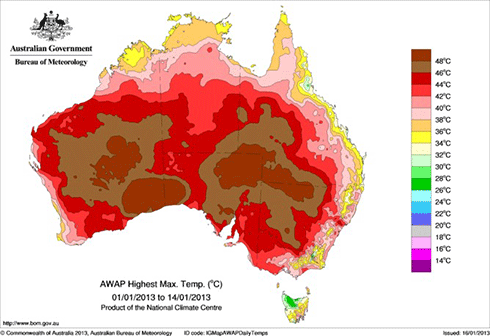
Most of Australia sweltered in 40°C-plus heat during the first two weeks of 2013 – a year that has seen the country record the highest-ever above-average temperatures. Credit:
Bureau of Meteorology
|
In its provisional annual statement on the Status of the Global Climate 2013 – released last week at the Warsaw UN climate change conference – the WMO provided a snapshot of regional and national temperatures, including observations of precipitation, floods, droughts, tropical cyclones, ice cover and sea-level.
The statement states that, during the first nine months of 2013, most of the world’s land areas had above-average temperatures, notably Australia, northern North America, north-eastern South America, northern Africa, and much of Eurasia.
Australia reported its hottest month ever observed in January 2013, leading to the hottest summer (December-February) on record. On 7 January a new national area-averaged daily maximum temperature of 40.3°C was set, and Moomba in South Australia, reached 49.6°C. Warmer-than-average temperatures have continued through the year, and the country recorded its all-time warmest 12-month period from November 2012-October 2013.
Along with the extreme heat, most of Australia had drier-than-average conditions throughout the year.
Globally, January-September 2013 was warmer than the same period in both 2011 and 2012, when La Niña had a cooling influence. Neither La Niña nor El Niño conditions were present during the first nine months of 2013 and are not expected to emerge by the end of the year.
El Niño/La Niña is a major driver of our climate and the hottest years on record, 2010 and 1998, both had El Niño events.
‘Temperatures so far this year are about the same as the average during 2001-2010, which was the warmest decade on record,’ said WMO Secretary-General Michel Jarraud.
‘All of the warmest years have been since 1998, and this year once again continues the underlying, long-term trend. The coldest years now are warmer than the hottest years before 1998,’ he said.
‘Atmospheric concentrations of carbon dioxide and other greenhouse gases reached new highs in 2012, and we expect them to reach unprecedented levels yet again in 2013. This means that we are committed to a warmer future.
‘Surface temperatures are only part of the wider picture of our changing climate. The impact on our water cycle is already becoming apparent – as manifested by droughts, floods and extreme precipitation.
The provisional WMO statement confirms that global sea level reached a new record high. Sea level has been rising at an average rate of about 3.2 milimetres per year (mm/yr), with inter-annual variability, since altimeter satellite measurements began in 1993. This is close to the observed rate of about 3 mm/yr of the most recent decade of 2001-2010 and double the observed 20th century trend of 1.6 mm/yr.
‘Sea levels will continue to rise because of melting ice caps and glaciers. More than 90 per cent of the extra heat we are generating from greenhouse gas is absorbed by the oceans, which will consequently continue to warm and expand for hundreds of years,’ said Mr Jarraud.
Arctic sea ice recovered slightly after the dramatic and unprecedented melt in 2012, but 2013 still saw one of the lowest levels on record. Since the beginning of satellite measurements in 1979, the decade 2001-2010 has seen the greatest average annual melting of Arctic sea ice on record and all seven of the lowest Arctic sea ice extents have occurred since 2007.
For the second year in a row, Antarctic sea ice extent in September reached a record – approximately 30,000 square kilometres larger than the previous record set in 2012. September Antarctic sea ice extent is increasing at an average rate of 1.1 per cent per decade.
Changes in the atmospheric circulation observed in the past three decades, which resulted in changes in the prevailing winds around Antarctica, are considered by scientists as factors related to this increase.
However, it is possible that this increase is due to a combination of factors that also include effects of changing ocean circulation.
Antarctica differs from the Arctic in that the Arctic is comprised of water surrounded by land. Conversely, the Antarctic is comprised of land surrounded by open ocean water. Wind patterns and ocean currents tend to isolate Antarctica from global weather patterns, keeping it cold.
WMO also recently released its annual Greenhouse Gas Bulletin.
Source: WMO


