|
Published: 17 March 2014
The evidence shows sea levels are rising: let’s not be caught out
Today much of the world’s population lives near the coast. At the same time, scientific evidence shows sea levels are rising. What will this mean for the world in the 21st century and beyond? What choices do we have?
|
|
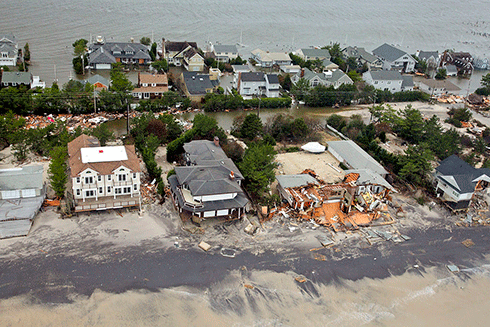
A New Jersey neighbourhood devastated by Hurricane Sandy in the US in 2012. Credit:
Master Sgt. Mark C. Olsen US Air Force
|
Coastal regions account for much of the world’s population and wealth. Some of these populations are already vulnerable to rising relative sea levels (the sea surface relative to the land). This occurs when sediments in deltas compact, and waterways supply less sediment to coastal regions. Some populations live on low-lying islands and coral atolls only a few metres above sea level.
Despite these problems, our coasts continue to undergo rapid economic development, increased urbanisation, and population growth, as more people make their way to the coasts in both developed and developing nations.
The Ganges–Brahmaputra delta at the northern end of the Bay of Bengal has shown us how vulnerable low-lying coastal areas are to extreme events. Cyclone Sidr in 2007 is estimated to have resulted in up to 10,000 deaths and US$1.7 billion of damage to Bangladesh and neighbouring areas. On the bay’s eastern edge, the death toll from Cyclone Nargis – which raged through Burma’s Irrawaddy delta in 2008 – exceeded 100,000, with an estimated damage bill of over US$10 billion.
In the developed world, Hurricane Katrina in 2005 resulted in well over 1000 deaths and around $US100 billion in damages for low-lying New Orleans and surrounding areas along the US coast. In 2012, Hurricane Sandy resulted in more than 280 deaths and about $US70 billion in damages.
Resolving the ‘sea-level enigma’
For several decades, 20th century sea-level rise presented a conundrum for climate scientists. Global mean sea level has increased throughout the 20th century. By 2012 sea level was 225 mm (± 30 mm) higher than in 1880, the earliest year for which robust estimates are available. However, in all of the first four IPCC Assessment Reports, the sum of contributions to sea-level rise was estimated to be less than the observed rise.
This discrepancy had been referred to as the ‘sea-level enigma’. Over the last decade, scientists have made significant progress in resolving the enigma with more robust and quantitative estimates of the causes for the observed rise, as documented in last year’s IPCC Fifth Assessment Report.
By far the two largest contributions to sea-level rise have been:
-
Ocean thermal expansion: Just like liquid in a thermometer, sea water expands as it warms. Observations since the early 1970s indicate the warming oceans account for more than 93 per cent of the energy absorbed by the climate systems, and that thermal expansion associated with this warming was responsible for about 30-40 per cent of the observed sea-level rise.
-
Net loss of glacial mass. As a result of this, glaciers around the world have been retreating.
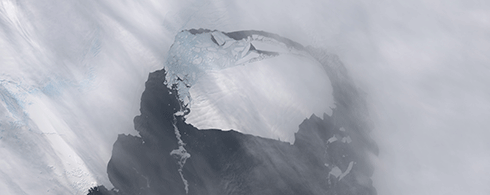
Over the last two decades, the polar ice sheets have also increasingly contributed to sea-level rise. Surface melting of the Greenland ice sheet has increased, and both Greenland and Antarctica are now losing mass from the increased discharge of glaciers into the ocean.
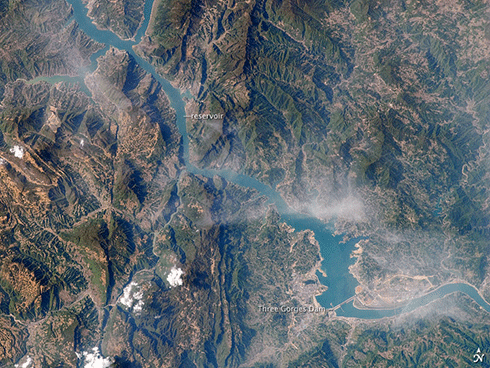
Perhaps surprisingly, the construction of terrestrial reservoirs – sometimes involving enormous catchment areas, such as the Aswan High dam in Egypt in the 1960s, and more recently the Three Gorges Dam in China – has resulted in the impoundment of enough waters to significantly reduce the amount of global sea-level rise that would otherwise have occurred.
Countering this is the extraction of groundwater, with most of this extracted water eventually finding its way to the ocean. During the 20th century, the rate of groundwater depletion increased and now exceeds the rate of impoundment in reservoirs. The net effect of changes in land water storage is expected to contribute further to sea-level rise during the 21st century.
What can we expect in future?
The science indicates that, over the course of the 21st century, ocean thermal expansion and the loss of mass from increased melting of glaciers will contribute tens of centimetres to further sea-level rise. Increased surface melting from the Greenland ice sheets will add to this rise.
The greatest uncertainty we face is around the flow of ice into the ocean from the great ice sheets of Greenland and West and East Antarctica.
|
|
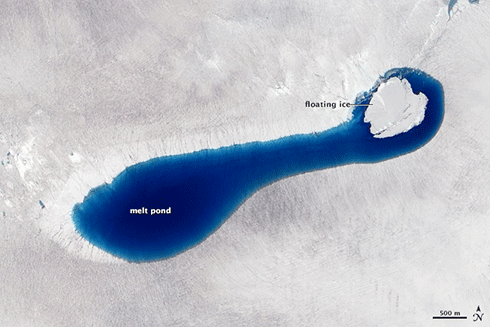
A melt pond on Greenland ice during summer: these act like plumbing drains, moving melted ice from the surface to the bottom of the ice sheet and eventually to the coast. Credit:
NASA
|
Observations and models indicate that the increased rate of flow of outlet glaciers over the last two decades in both West Antarctica and Greenland is related to rising ocean temperatures underneath, and adjacent to, the ice shelves. Whether this localised ocean warming is related to anthropogenic climate change or natural variability – or, for Antarctica, changes in winds associated with the ozone hole – remains an unanswered question. However, climate change will see these ocean temperatures increase during the 21st century and beyond.
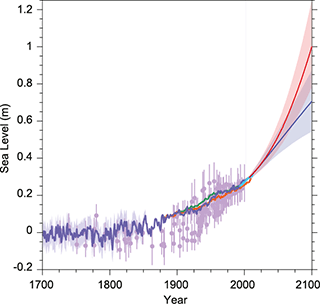
The projected global average sea-level rise from 1995 to 2100 will likely be in the range 0.28–0.61 m if there is very significant mitigation of greenhouse gas emissions, to 0.52–0.98 m if greenhouse gas emissions continue as a result of society taking a ‘ business as usual’ approach.
A larger rise is possible if there is an instability (see below) of the Antarctic ice sheet. While the magnitude of this additional rise cannot be precisely quantified, there is medium confidence it would not exceed several tenths of a metre by 2100.
The longer term
As the Greenland ice sheet loses mass, the glaciers will retreat from the ocean and will be less affected by ocean warming.
However, the West Antarctic Ice sheet is grounded below sea level, with the land below the ice sheet getting deeper with distance from the ocean. This means the Antarctic ice sheet will respond to ocean warming for hundreds of years into the future, and raises the potential for a marine ice sheet instability in which increased ice flow will lead to a retreat of the grounding line (the grounding line is where a glacier exporting ice from the continent loses contact with the ground and becomes a floating ice shelf) and further increase in ice flow.
Greenland is approaching another type of threshold, in which surface melting exceeds precipitation. Crossing this threshold will result in an ongoing shrinking of the ice sheet, regardless of how the flow of ice into the ocean might change. This threshold could be crossed as early as the latter half of the 21st century, if the world’s nations do not significantly reduce their current greenhouse gas emissions.
What does this mean for us? Mitigation and adaptation
Sea-level rise caused by ocean warming is a long-term phenomenon. The world is already committed to further sea-level rise from greenhouse gas emissions that occurred during the 20th century. Even with the strongest mitigation scenarios being considered, sea level will continue to rise throughout the 21st century. In short, we cannot stop all sea-level rise, therefore it will be essential to adapt.
If we adopt a ‘business as usual’ strategy and continue globally to generate greenhouse gas emissions at an increasing rate, a further acceleration in the rate of rise during the 21st century could result in sea-level rise exceeding one metre sometime during the 22nd century. And sea level would continue to rise for many centuries after that.
|
|
Paleo sea level data, tide gauge data, altimeter data and projections of global mean sea level rise for two different climate futures, post-2000, relative to pre-industrial values. The blue line (extending from the centre to the right) represents an ambitious GHG mitigation scenario (atmospheric CO2-equivalent levels capped at 490 ppm) that would see emissions peak before 2100 then fall due to active removal of CO2. The red line represents a ‘business as usual’ scenario with little or no effort to reduce emissions. This would see atmospheric CO2-equivalent levels rise to more than 1370 ppm by 2100, and continue to rise. Credit:
IPCC1
|
As mean sea-level continues to rise during the 21st century, the frequency of coastal flooding events will increase. In some regions, and for the higher sea-level rise scenarios, what is currently a 1-in-100 year flooding event could occur every year by 2100. The most severe coastal storm surges will be higher by the amount of mean sea-level rise, assuming storm intensity does not also change.
Rising sea levels are also likely to result in increased coastal erosion, already a major issue in many coastal areas around the globe.
It is clear that we will have to adapt to rising sea levels during the 21st century and beyond. The amount of adaptation that will be necessary will depend on how humanity mitigates its greenhouse gas emissions today and in the future – larger emissions lead to a larger sea-level rise. As a society, we also need to plan how we will adapt – how we will minimise the impacts of, and respond to, extreme events. Adaptation options include:
-
Retreat – abandoning parts of the coastline that are too expensive to protect, or relocating people from coastal regions or islands where it may become too dangerous to continue to live. This practice is already underway through both planning and neglect.
-
Accommodate – live with rising sea levels by modifying infrastructure and carrying out appropriate planning within the coastal zone. Storm-surge shelters and appropriate storm-surge warnings have already saved many thousands of lives in Bangladesh and elsewhere.
-
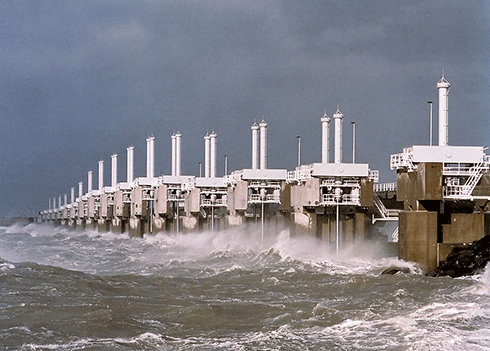
Protect – building, extending and using more frequently barriers such as the Thames Barrage, the dykes of the Netherlands, and the Rotterdam Maeslantkering storm-surge barrier, or soft protection measures such as beach nourishment. However, engineering measures do not protect the natural environment and can also lead to catastrophic situations when they fail, as clearly demonstrated in New Orleans.
Without urgent, significant and sustained greenhouse gas mitigation, we are likely to see temperatures cross a threshold that will lead to irreversible melting of the Greenland ice sheet, ongoing ocean thermal expansion and loss of mass from glaciers and, at higher greenhouse gas concentrations, an ongoing contribution from the Antarctic ice sheet. This will result in a sea-level level rise of metres over centuries.
If we fail to plan for the future, the environment will do it for us – with less than optimal results.
|
|
The Netherlands’ Oosterscheldekering (‘ Eastern Scheldt storm surge barrier’), at work during a storm. The barrier, between two islands, is the largest of 13 dams and storm surge barriers designed to protect the country from flooding from the North Sea, which last happened in 1953, leaving a trail of destruction and death. Credit:
Dutch Ministry of Infrastructure and the Environment , Rijkswaterstaat.
|
Dr John Church is a CSIRO Fellow with the Centre for Australian Weather and Climate Research -- a partnership between CSIRO and the Bureau of Meteorology. He is an internationally recognised expert on the role of the ocean in climate, particularly in relation to anthropogenic climate change and sea-level rise. Dr Church was co-convening lead author for the chapter on Sea Level Change in the IPCC Third Assessment Report and the latest Fifth Assessment Report. This is an edited and updated version of a chapter from the CSIRO Publishing book Living in a Warmer World, edited by Professor Jim Salinger.
1 Church, J.A., P.U. Clark, A. Cazenave, J.M. Gregory, S. Jevrejeva, A. Levermann, M.A. Merrifield, G.A. Milne, R.S. Nerem, P.D. Nunn, A.J. Payne, W.T. Pfeffer, D. Stammer and A.S. Unnikrishnan, 2013: Sea Level Change. In: Climate Change 2013: The Physical Science Basis. Contribution of Working Group I to the Fifth Assessment Report of the Intergovernmental Panel on Climate Change [Stocker, T.F., D. Qin, G.-K. Plattner, M. Tignor, S.K. Allen, J. Boschung, A. Nauels, Y. Xia, V. Bex and P.M. Midgley (eds.)]. Cambridge University Press, Cambridge, United Kingdom and New York, NY, USA.


